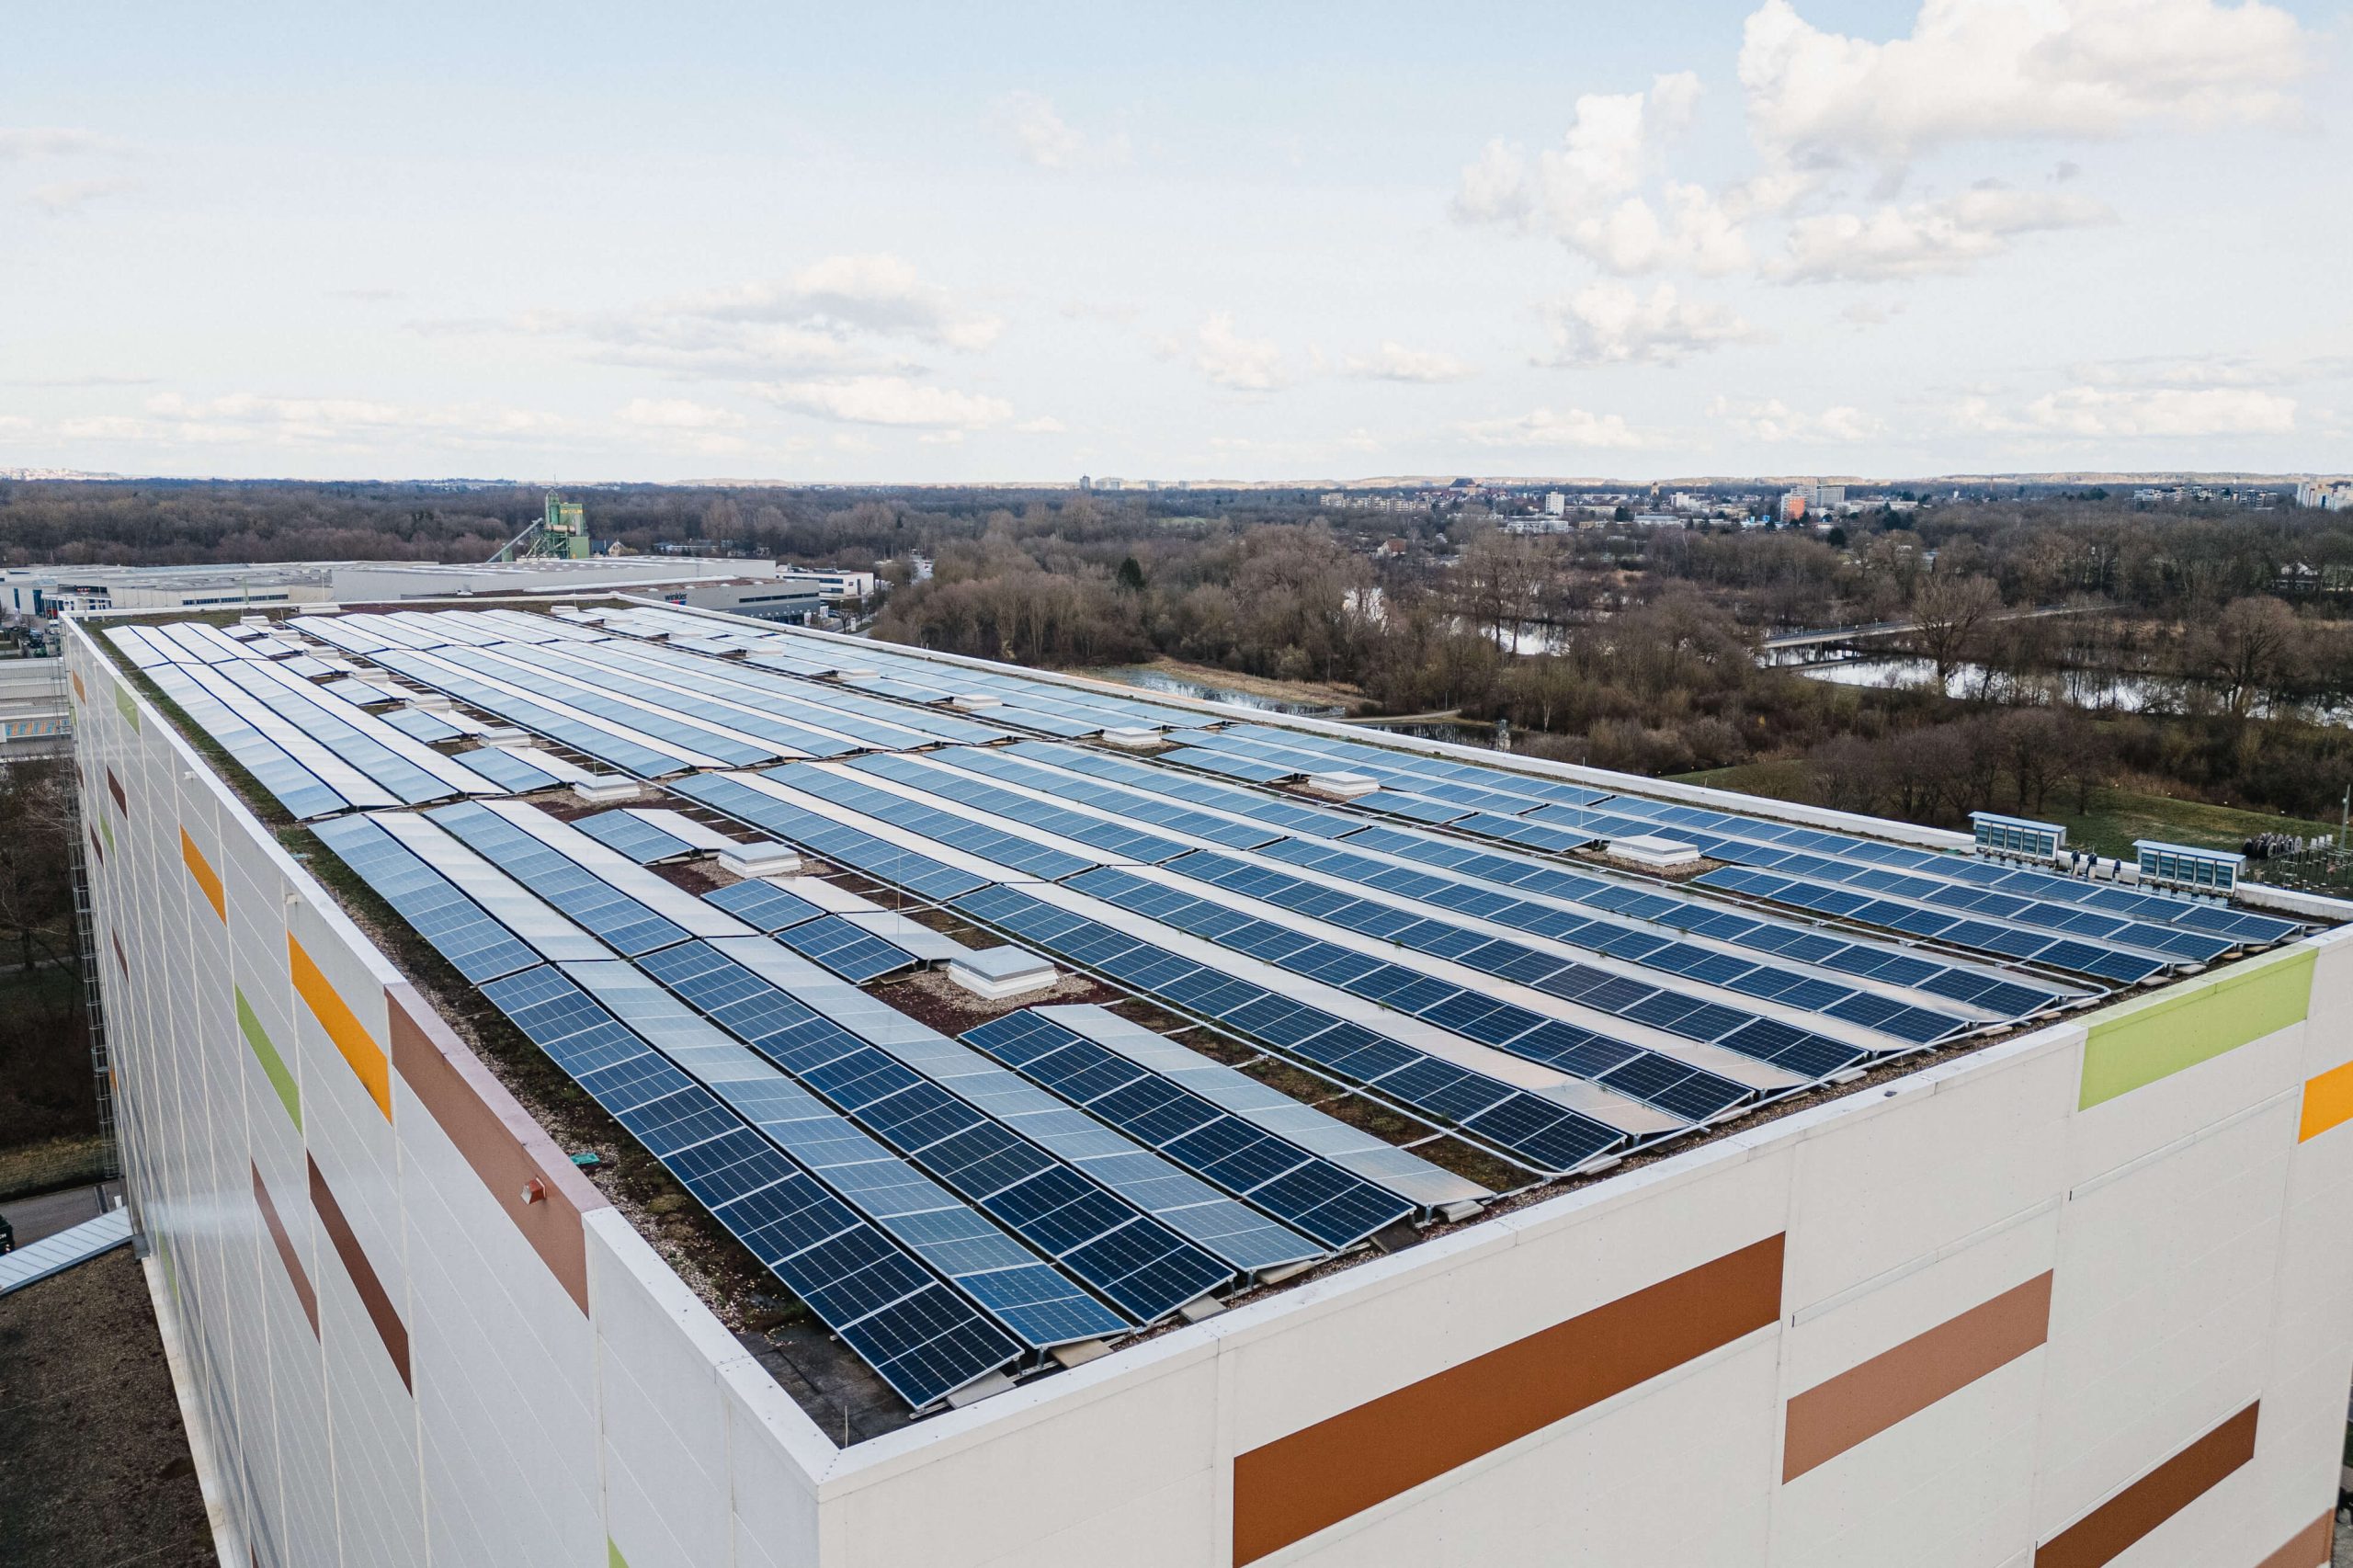
Photovoltaik-Module bedecken ein großes Flachdach, umgeben von einer ländlichen Umgebung.

Climate Protection Action Area

Our sustainable climate strategy

Record temperatures, droughts, floods—we are feeling the effects of climate change more and more clearly around the world. And not just in distant countries of origin. Whether it’s hazelnuts from Italy or walnuts from Chile, our Seeberger natural products are grown in many countries severely affected by climate change. Climate change is affecting the cultivation and harvesting of our products worldwide. Growth cycles are shifting, and harvests may be smaller or fail entirely. Our commitment? To firmly integrate climate protection into our daily operations and strategic decisions.

We have been working to implement our climate protection strategy since 2013. We conserve energy wherever possible. We have been using 100% green electricity since 2014 and are increasingly turning to electric mobility. We generate our own energy using modern photovoltaic systems—and much more. We have been tracking our emissions since 2013. Since 2022, we’ve even been reviewing our current status annually through a comprehensive corporate carbon footprint assessment covering CO2 emissions at our site and in production (Scope 1 and 2). Based on this, we can plan concrete measures and set reduction targets.
Effective climate protection involves three steps: measuring emissions, reducing them, and offsetting the remaining emissions by investing in climate protection projects. This is how we operate at Seeberger: We’ve been compiling a carbon footprint report for our facility since 2013. Every two years, we use this report to identify where and in what quantities CO2 emissions are generated at our facility and in our production processes. The Seeberger carbon footprint is the starting point for our climate protection strategy and helps us determine the effectiveness of our measures. Based on this, we plan further measures to reduce emissions and set ambitious goals in our climate protection strategy. .

Measure emissions
Since 2022, we have been comprehensively tracking our emissions annually through our corporate carbon footprint report, which we use to measure progress and set new reduction targets. In addition, we are expanding our reporting and are currently developing selected product carbon footprint reports for nuts, fruits, and coffee.
Reduce emissions
From 2013 to 2018, we reduced our CO2 emissions by 21 % thanks to energy saving measures, switching to green energy and producing our own energy with photovoltaics.
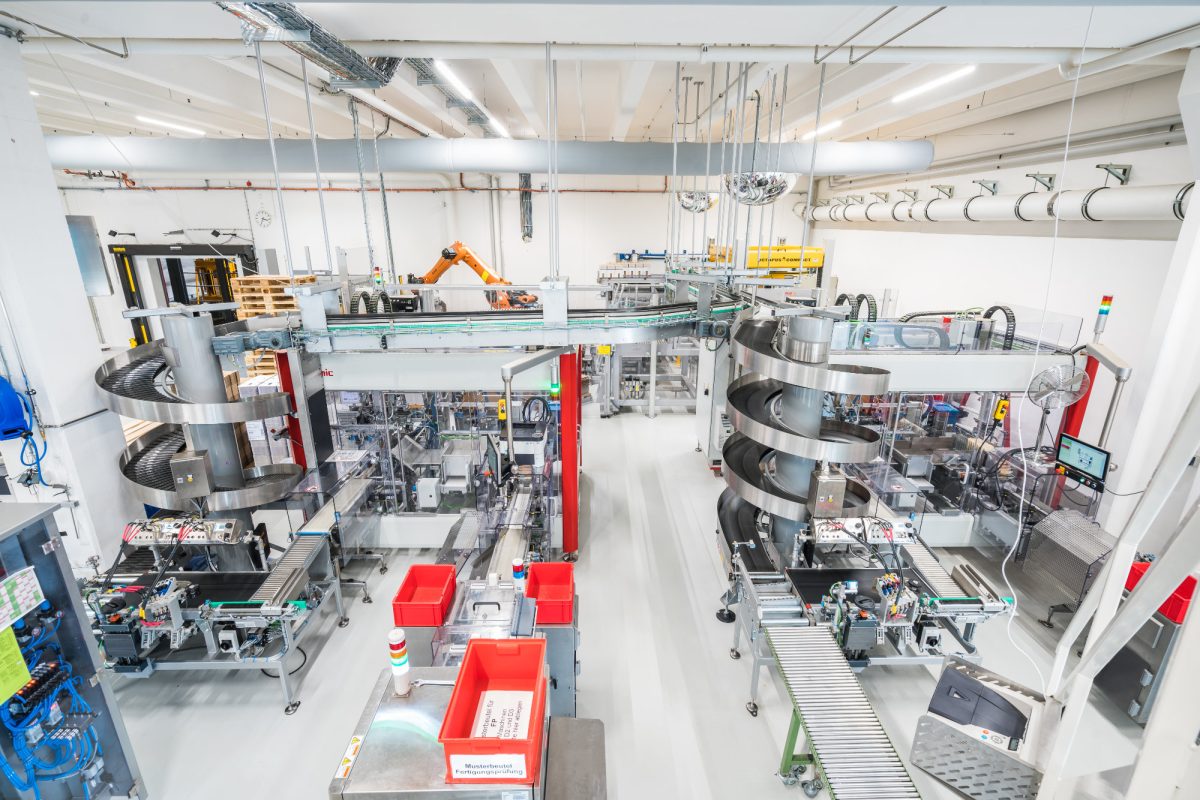
Das Bild zeigt eine Halle in der sich mehrere Maschinen zur Verpackung von Produkten befinden.

Overview of our infrastructure measures

  • We’ve consistently been using 100 % green energy since 2014.
  • Our photovoltaic systems also supply us with green energy and are a cornerstone of our sustainable energy supply.
  • Use of energy-efficient systems and the latest building technology
  • Conversion to LED lighting at our facilities
  • Installation of motion sensors for efficient lighting use
  • Renovation of the building envelope for improved energy efficiency
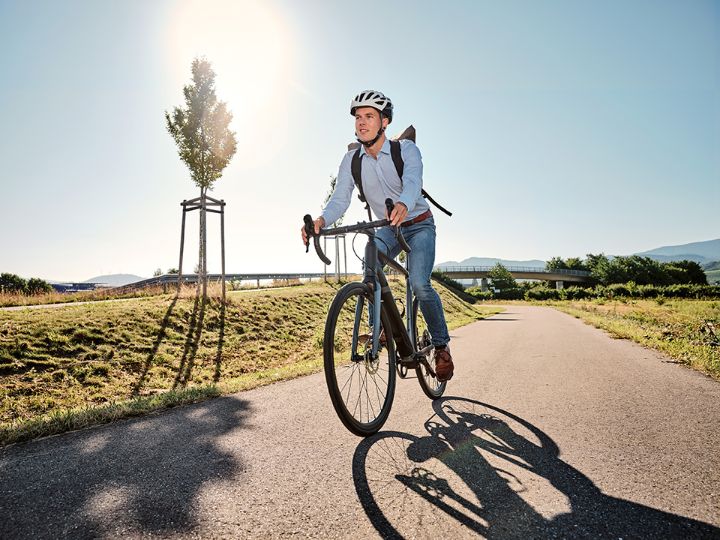
Radfahrer auch Weg mit Landschaft

Mobility in focus

We’ve developed climate-friendly mobility concepts for our employees:

  • Free annual travel cards for public transport
  • The option of a “JobBike” for an eco-friendly commute
Luftaufnahme eines Containerschiffs auf dem Meer

Efficiency in transport logistics

93% of our raw materials are transported by ship. We do not use air freight at all. We load our containers as fully as possible. To minimize the weight of the shipment, we dry all fruits in their country of origin.

Supply chain milestones –

achievements so far

2013

Icon zu

Since 2013, we have been preparing a carbon footprint report every two years. Starting in 2022, we have been preparing a comprehensive corporate carbon footprint report annually.

2014/16

Icon zu Ökostrom: Photovoltaik-Panel mit Steckdose und Sonne

In 2014, we switched to 100% green electricity. As early as 2016, we installed our first solar power system on the roof of our administrative building.

2018

Icon zu

By 2018, we had reduced our greenhouse gas emissions by 21% compared to the base year of 2013.

2020

Icon zu Meilenstein

Since 2020, we’ve been generating some of our power requirement at the Ulm location ourselves by installing photovoltaic systems. Following the most recent expansion in 2023, we're now at 13 % self-sufficiency.